Published at October 26th, 2025
•
Last updated 9 days ago
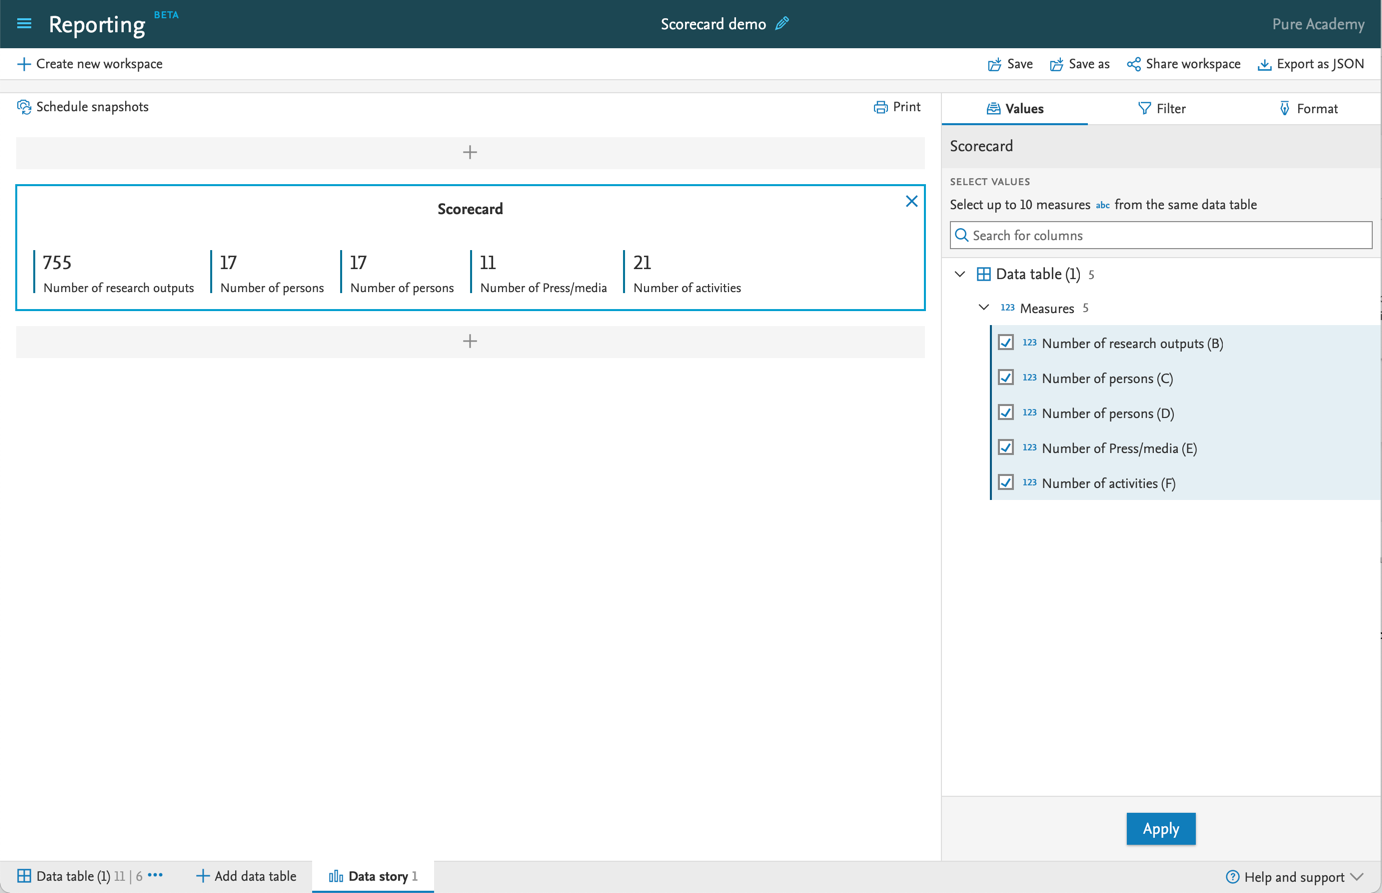
Highlight key numbers - use the scorecard
Have you seen that you can add “Scorecard” as a visualization to your data story? It is a nice little widget you can use to provide your end users with a quick overview on some numbers you would like to highlight.
A few suggestions:
- Total numbers of Research output/Projects/Activities/Awards etc
- Total number year by year
- Total number of citations
- Total awarded amount from a specific funder
- Total applied amount
- Average Impact factor
- Number of downloads
- Ect
Screenshot