Published at October 26th, 2025
•
Last updated 8 days ago
Rearranging columns in the data table (data story)
The data story contains different visualisation options. My favourite is the "data table". Perhaps not that colourful, but a really nice way of displaying and playing with a subset of the data collected on your data table. Adding different "groupings" or multiple "groupings" gives you a new insight into your data
But did you know that you can easily rearrange the columns in your data story - to find the new stories?
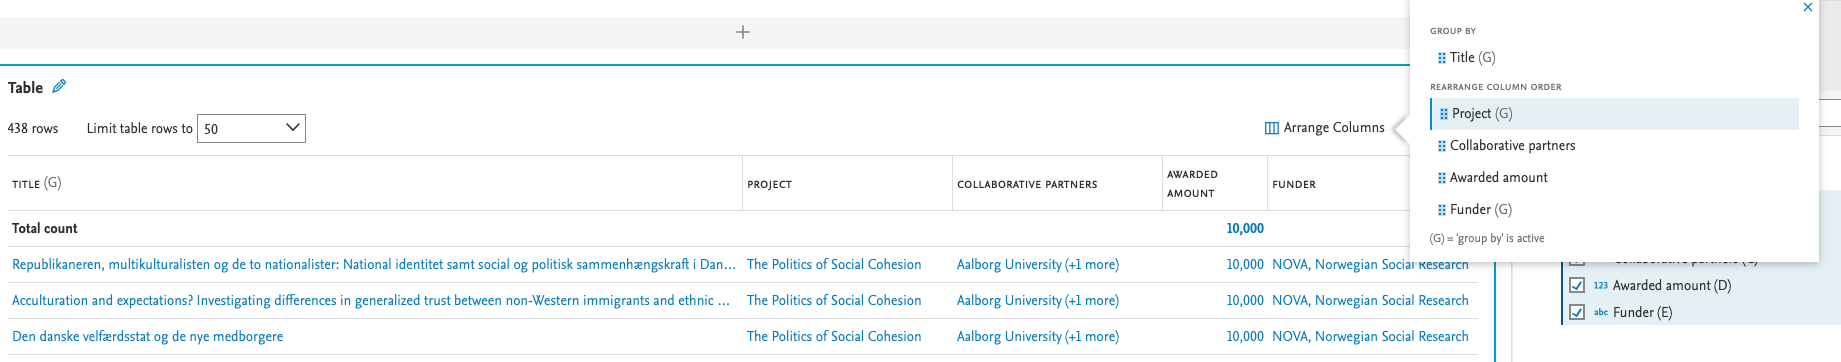
You can do this by navigating to the top of the table → click on "Arrange Columns" → In the pop-up you can rearrange the column order by drag and drop the element in the order you wish
Screenshot